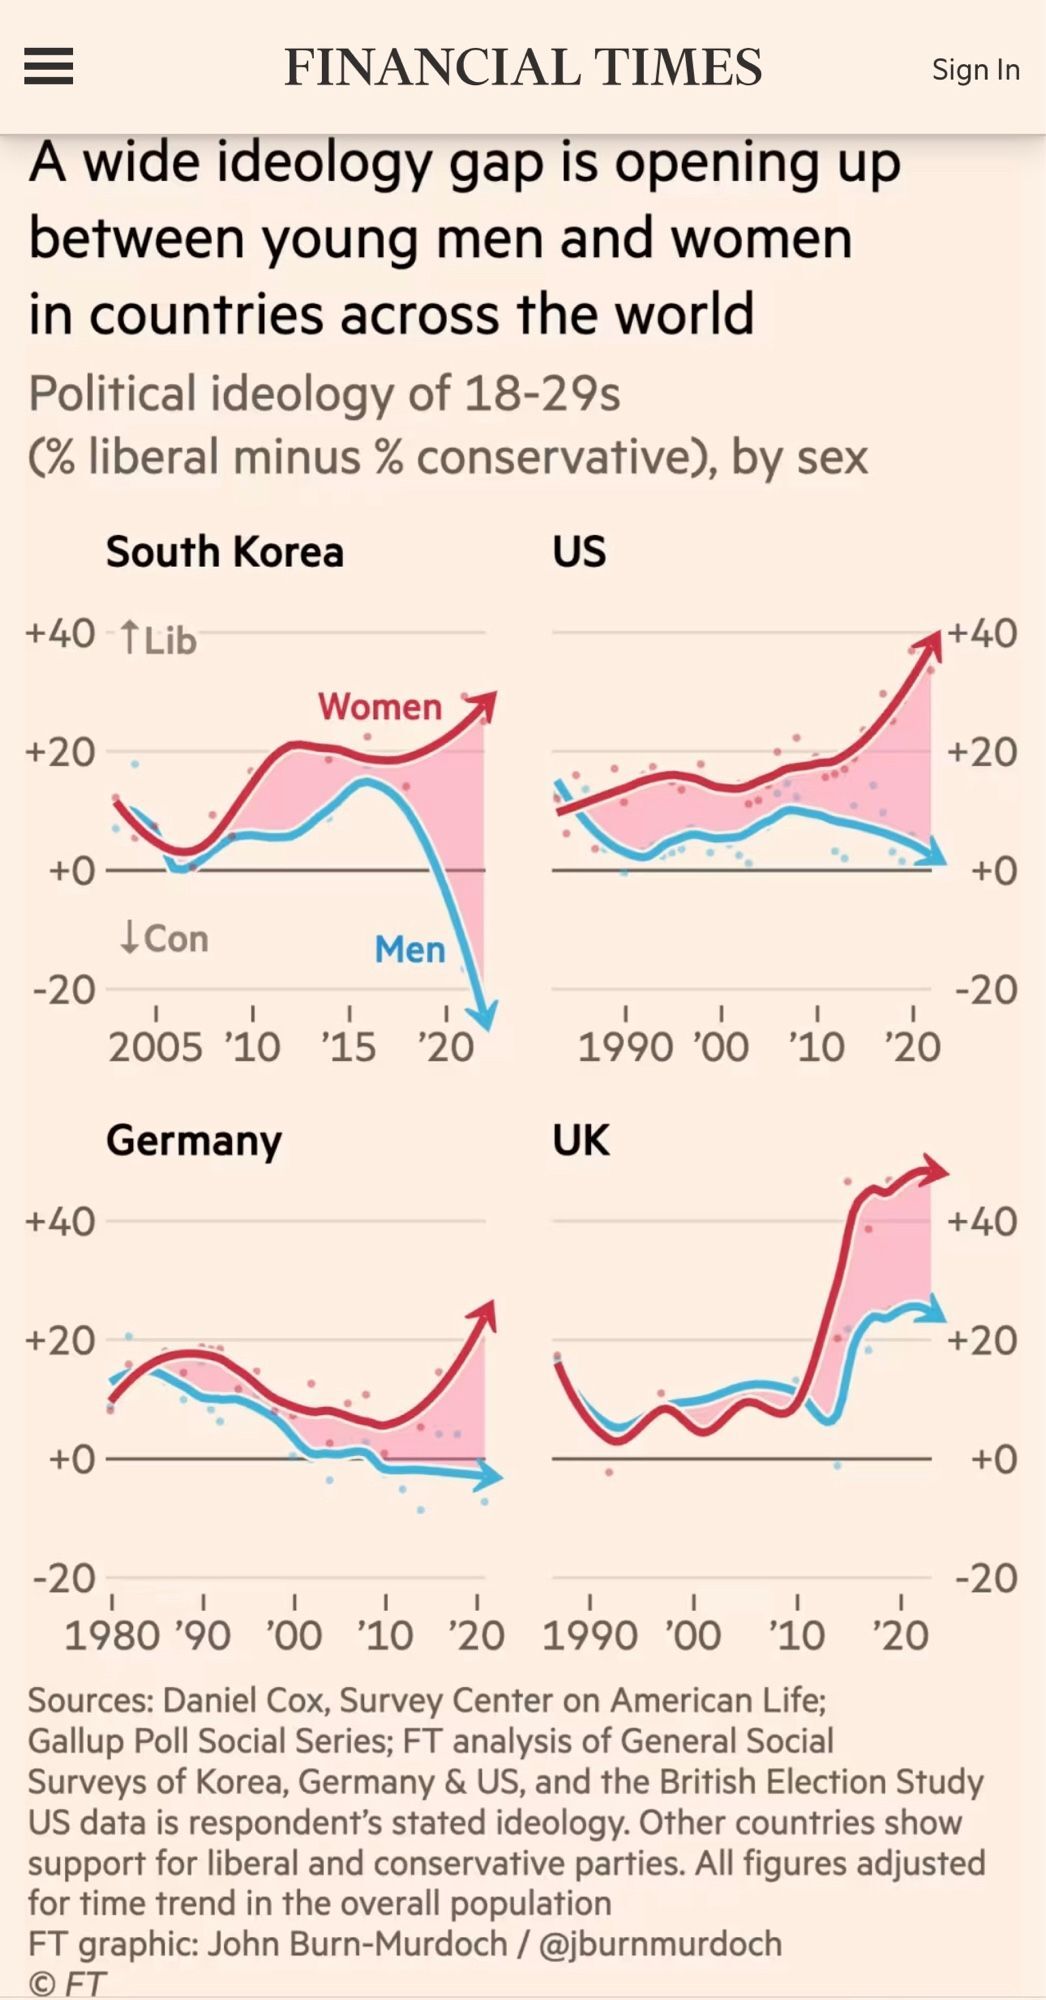
Perpetuates the false dichotomy of a linear political spectrum of either liberal or conservative and that in and of itself is one of the reasons for these trends
the graph explicitly takes 1 dimension of the spectrum to look at it in isolation. This is exactly what single graphs do best.
which this survey completely ignores, conveniently

the graph explicitly takes 1 dimension of the spectrum to look at it in isolation. This is exactly what single graphs do best.
have you looked at the source of the graph?